 Sheet2Chart
Turn your spreadsheet into an interactive dashboard.
Upload Excel or CSV and instantly get charts, insights, filters and AI analysis.
- Private by default
- No setup required
Showcases
See what a spreadsheet looks like as a dashboard
Three sample files, run through the same pipeline as your upload. Open them without an account.
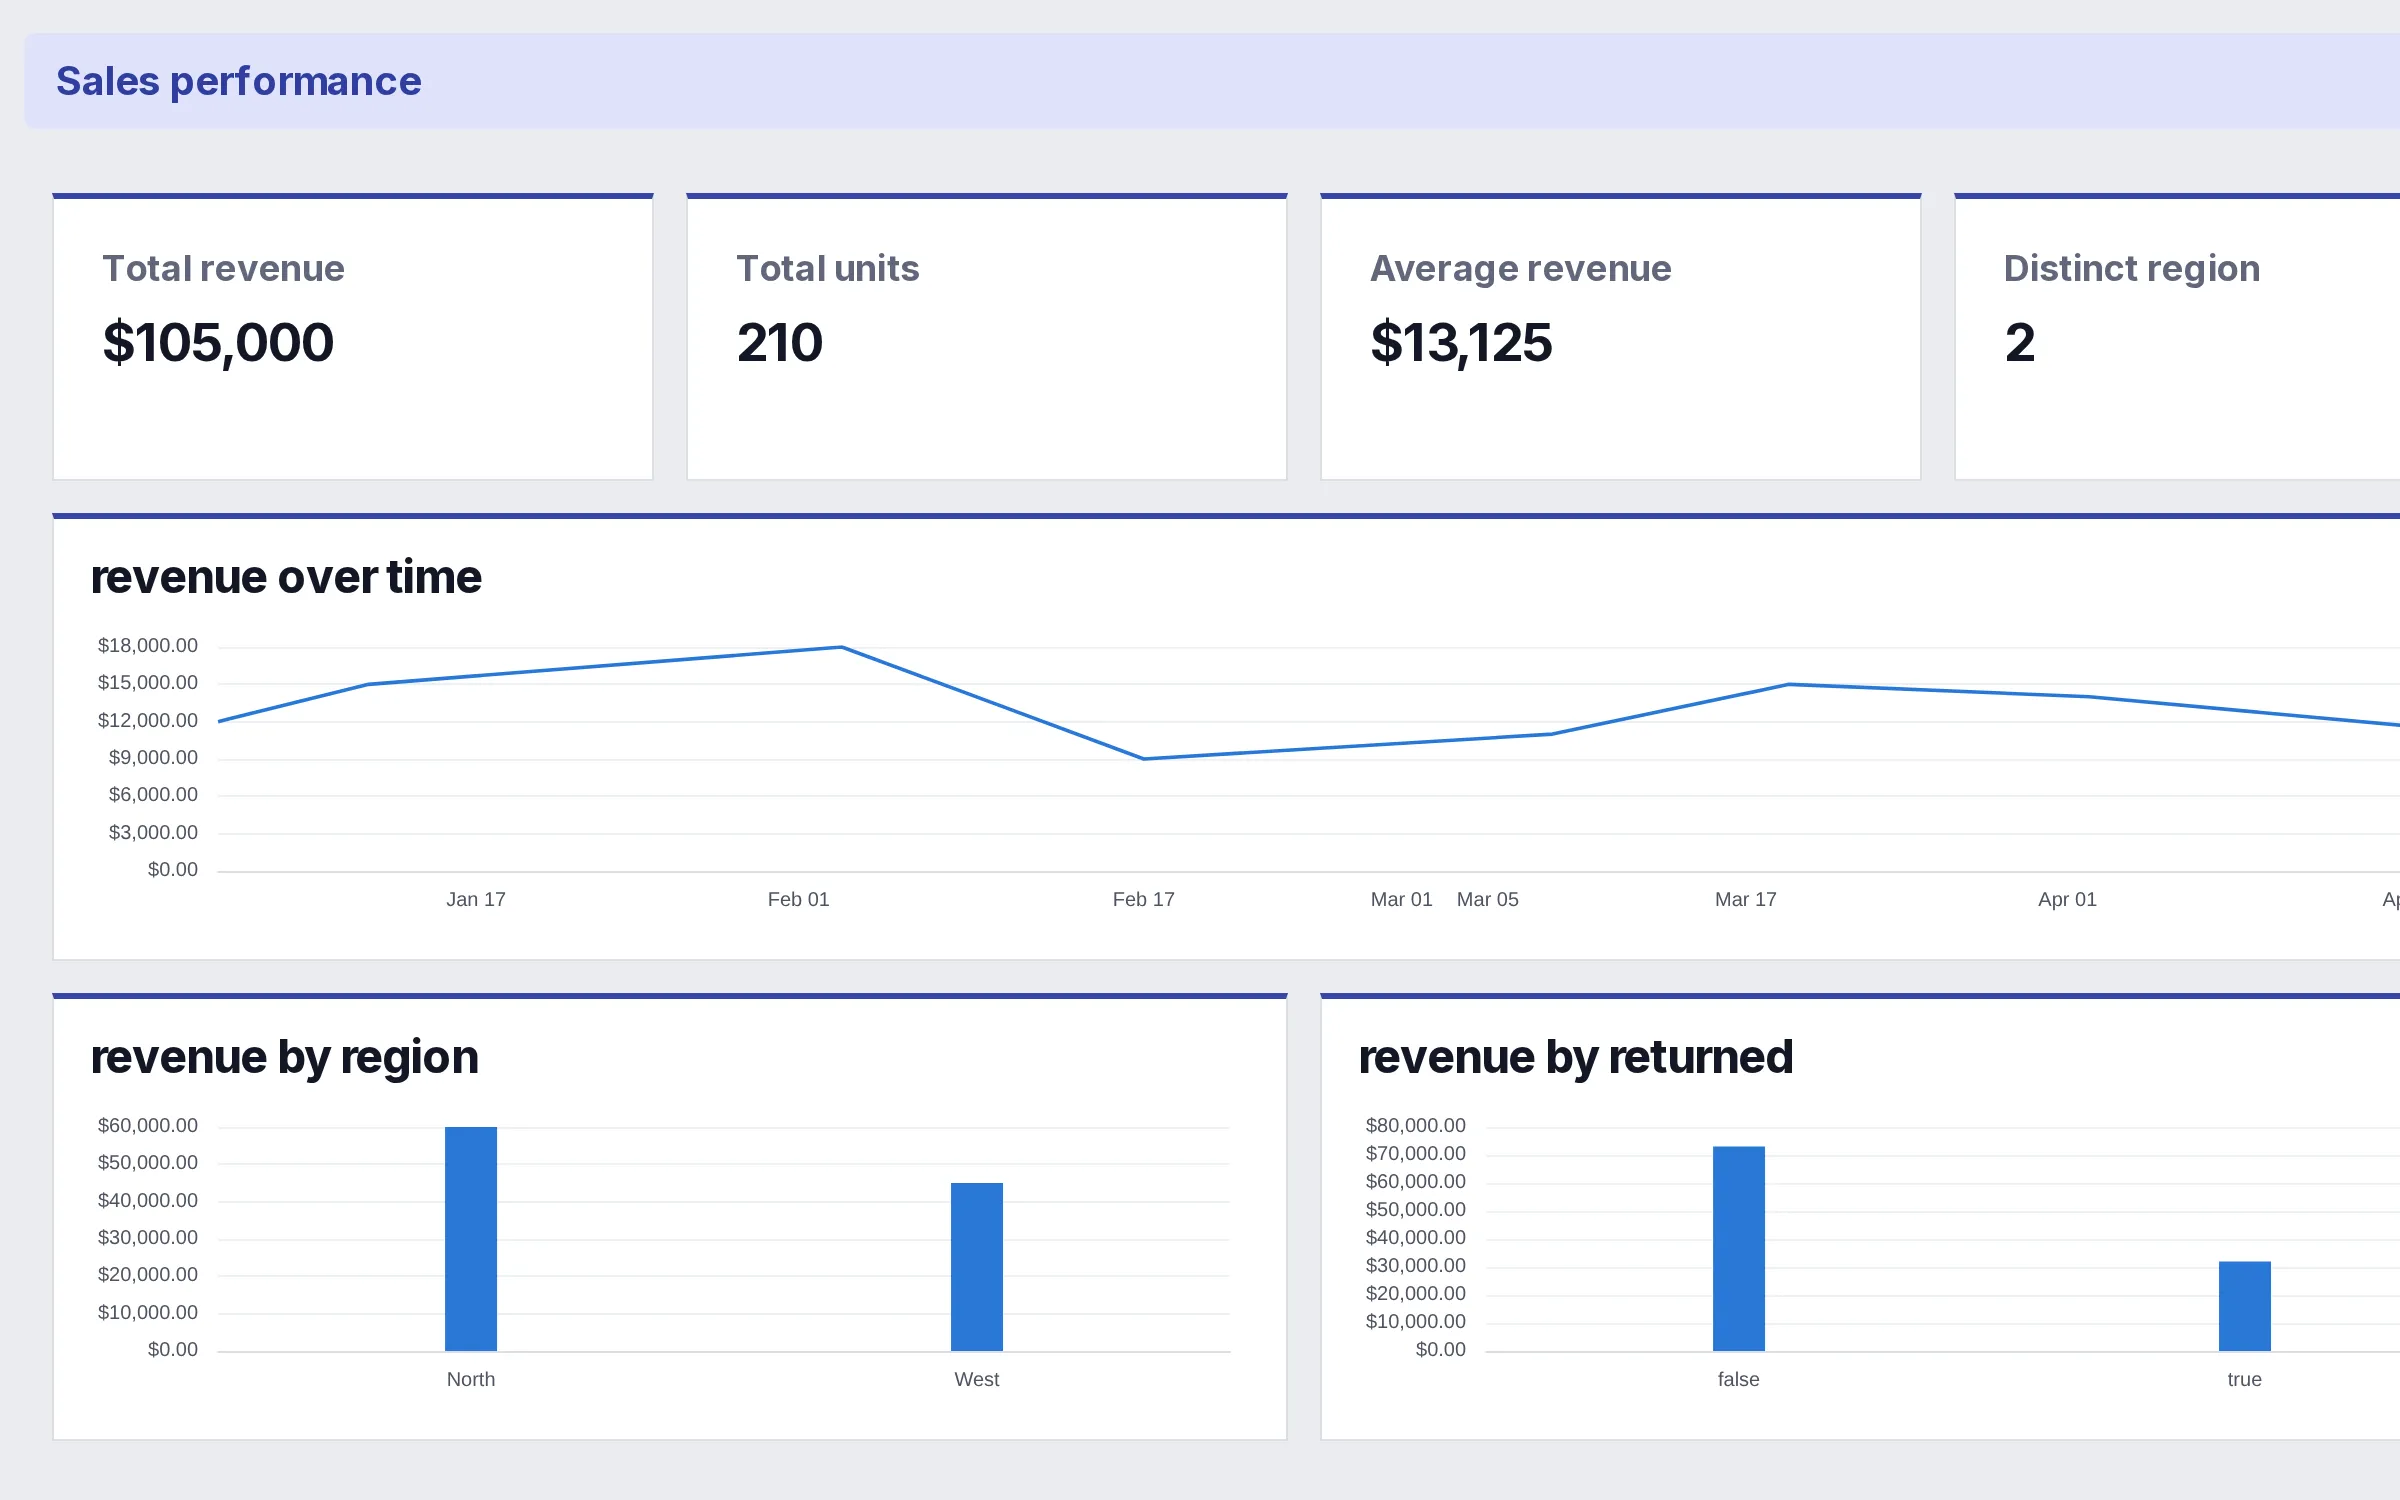
Sales performance
Revenue and units by region, channel and product, with returns flagged.
sales.csv · 7 columns
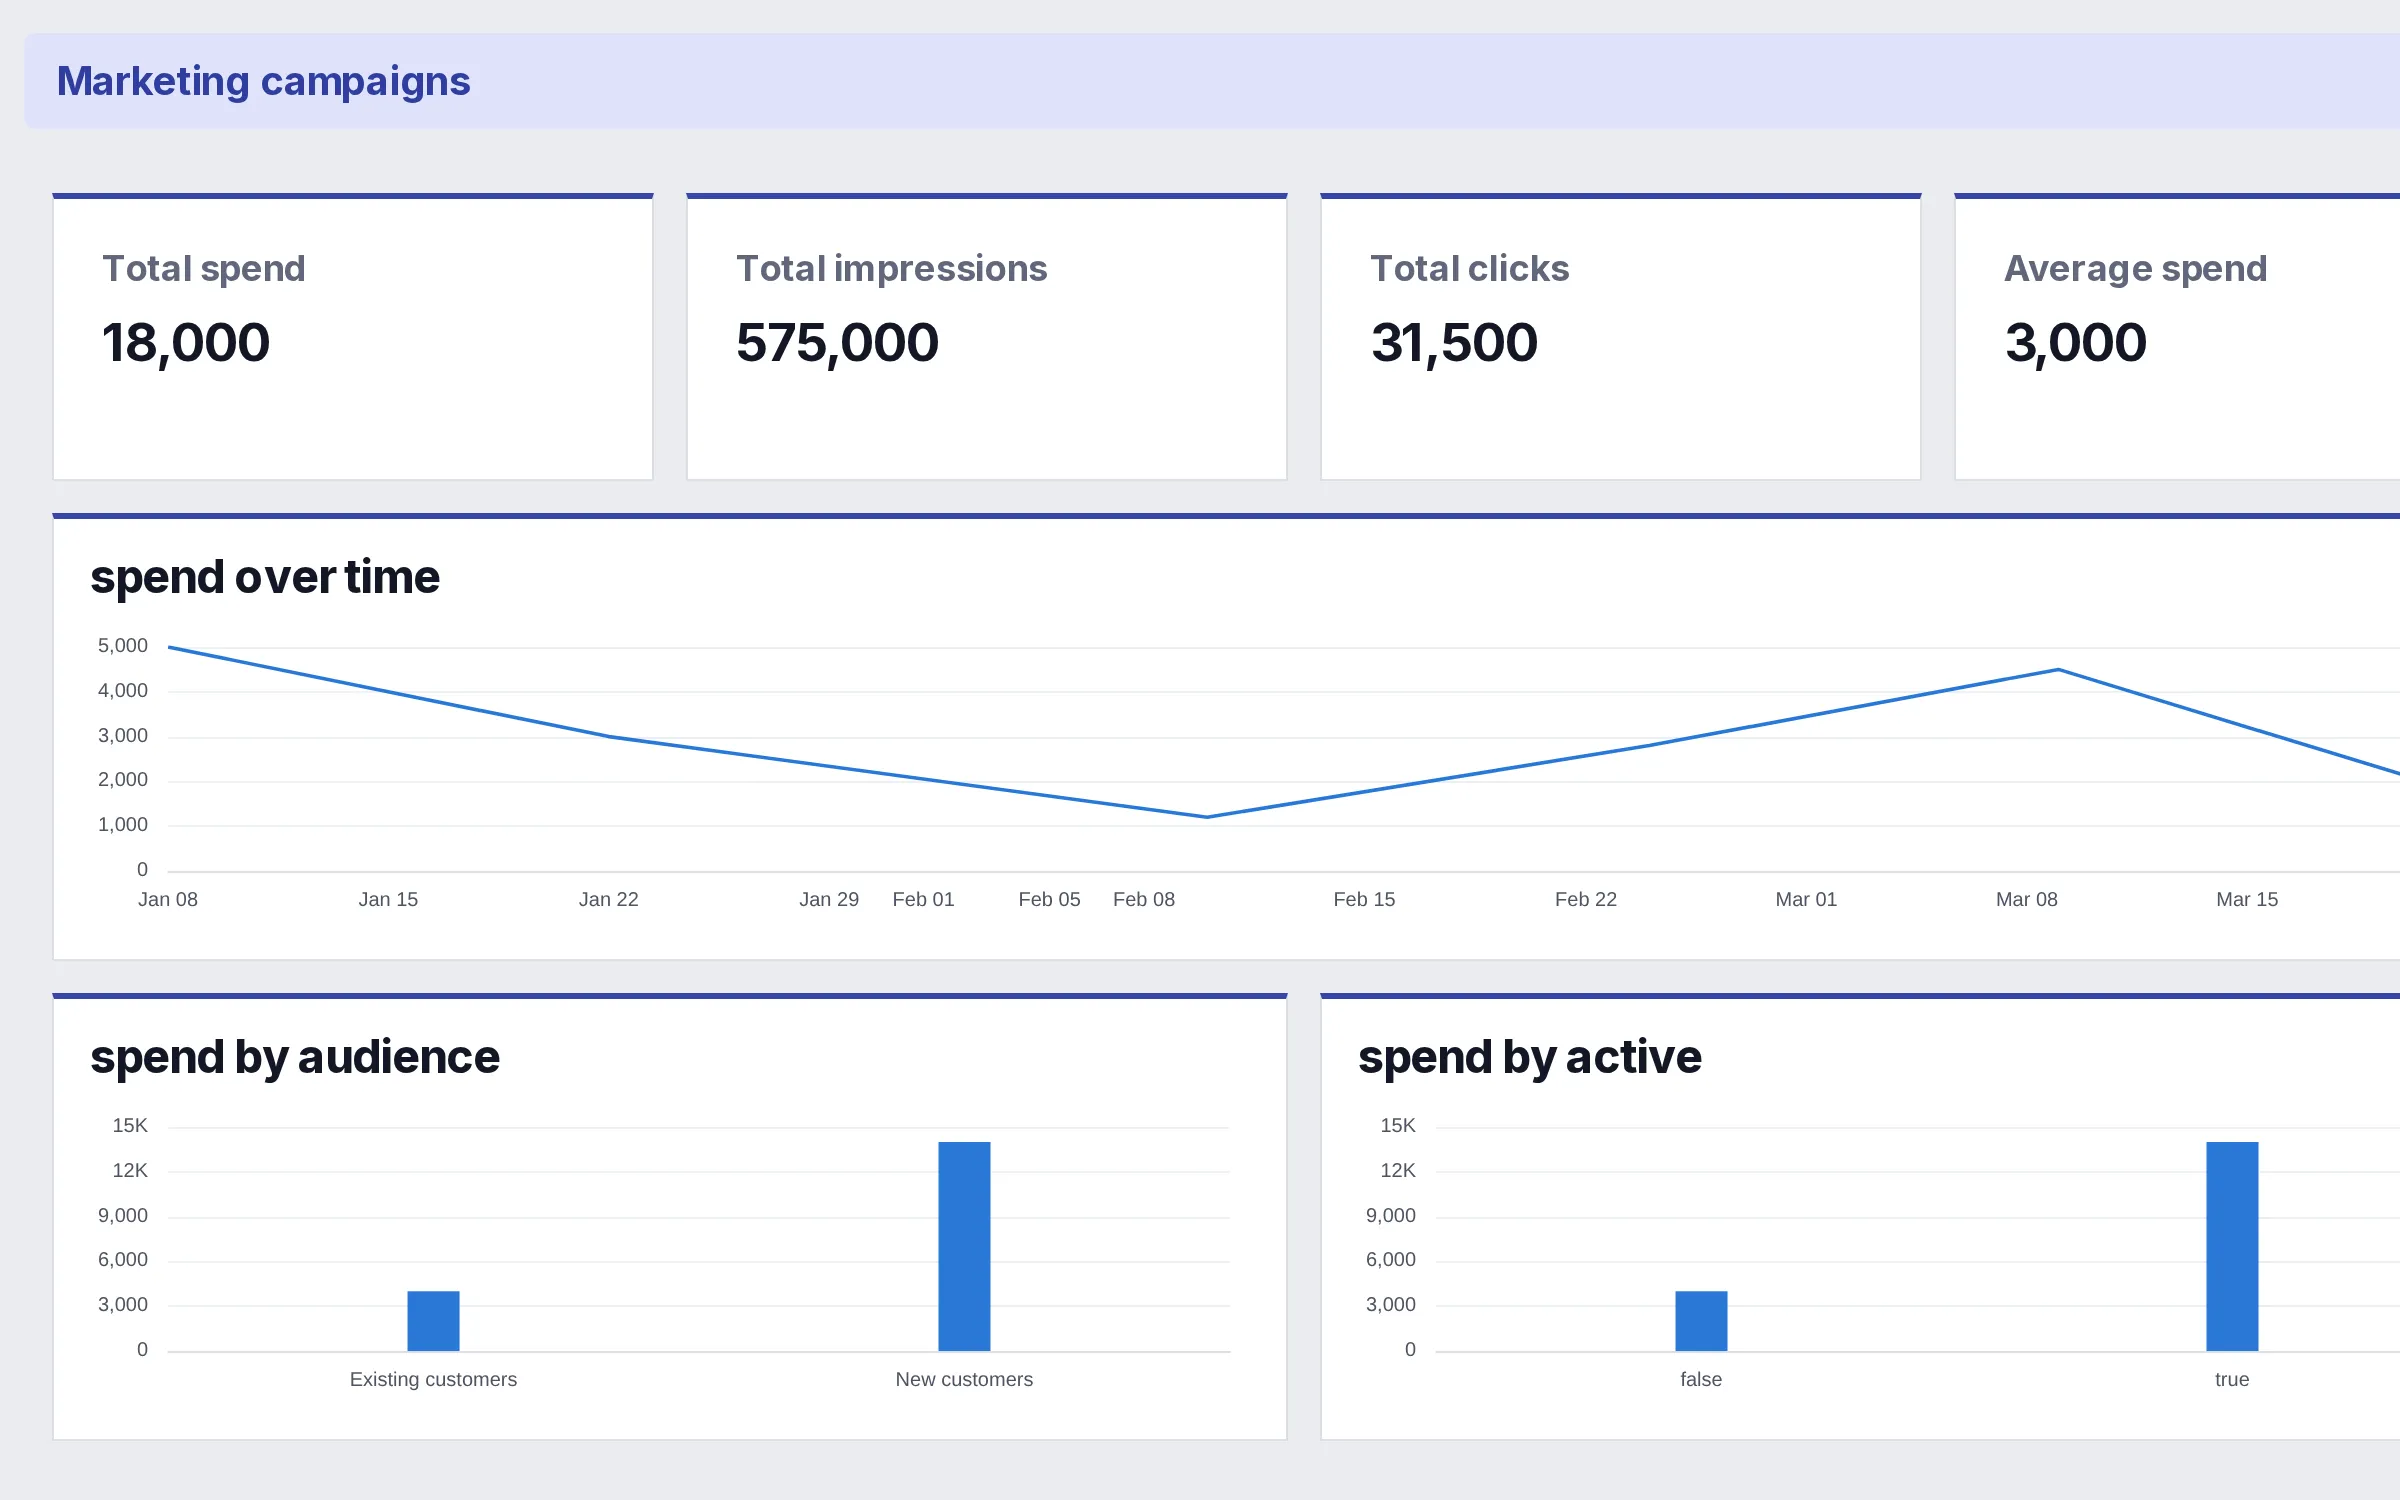
Marketing campaigns
Spend, impressions, clicks and conversions across every campaign and channel.
marketing-campaigns.csv · 9 columns
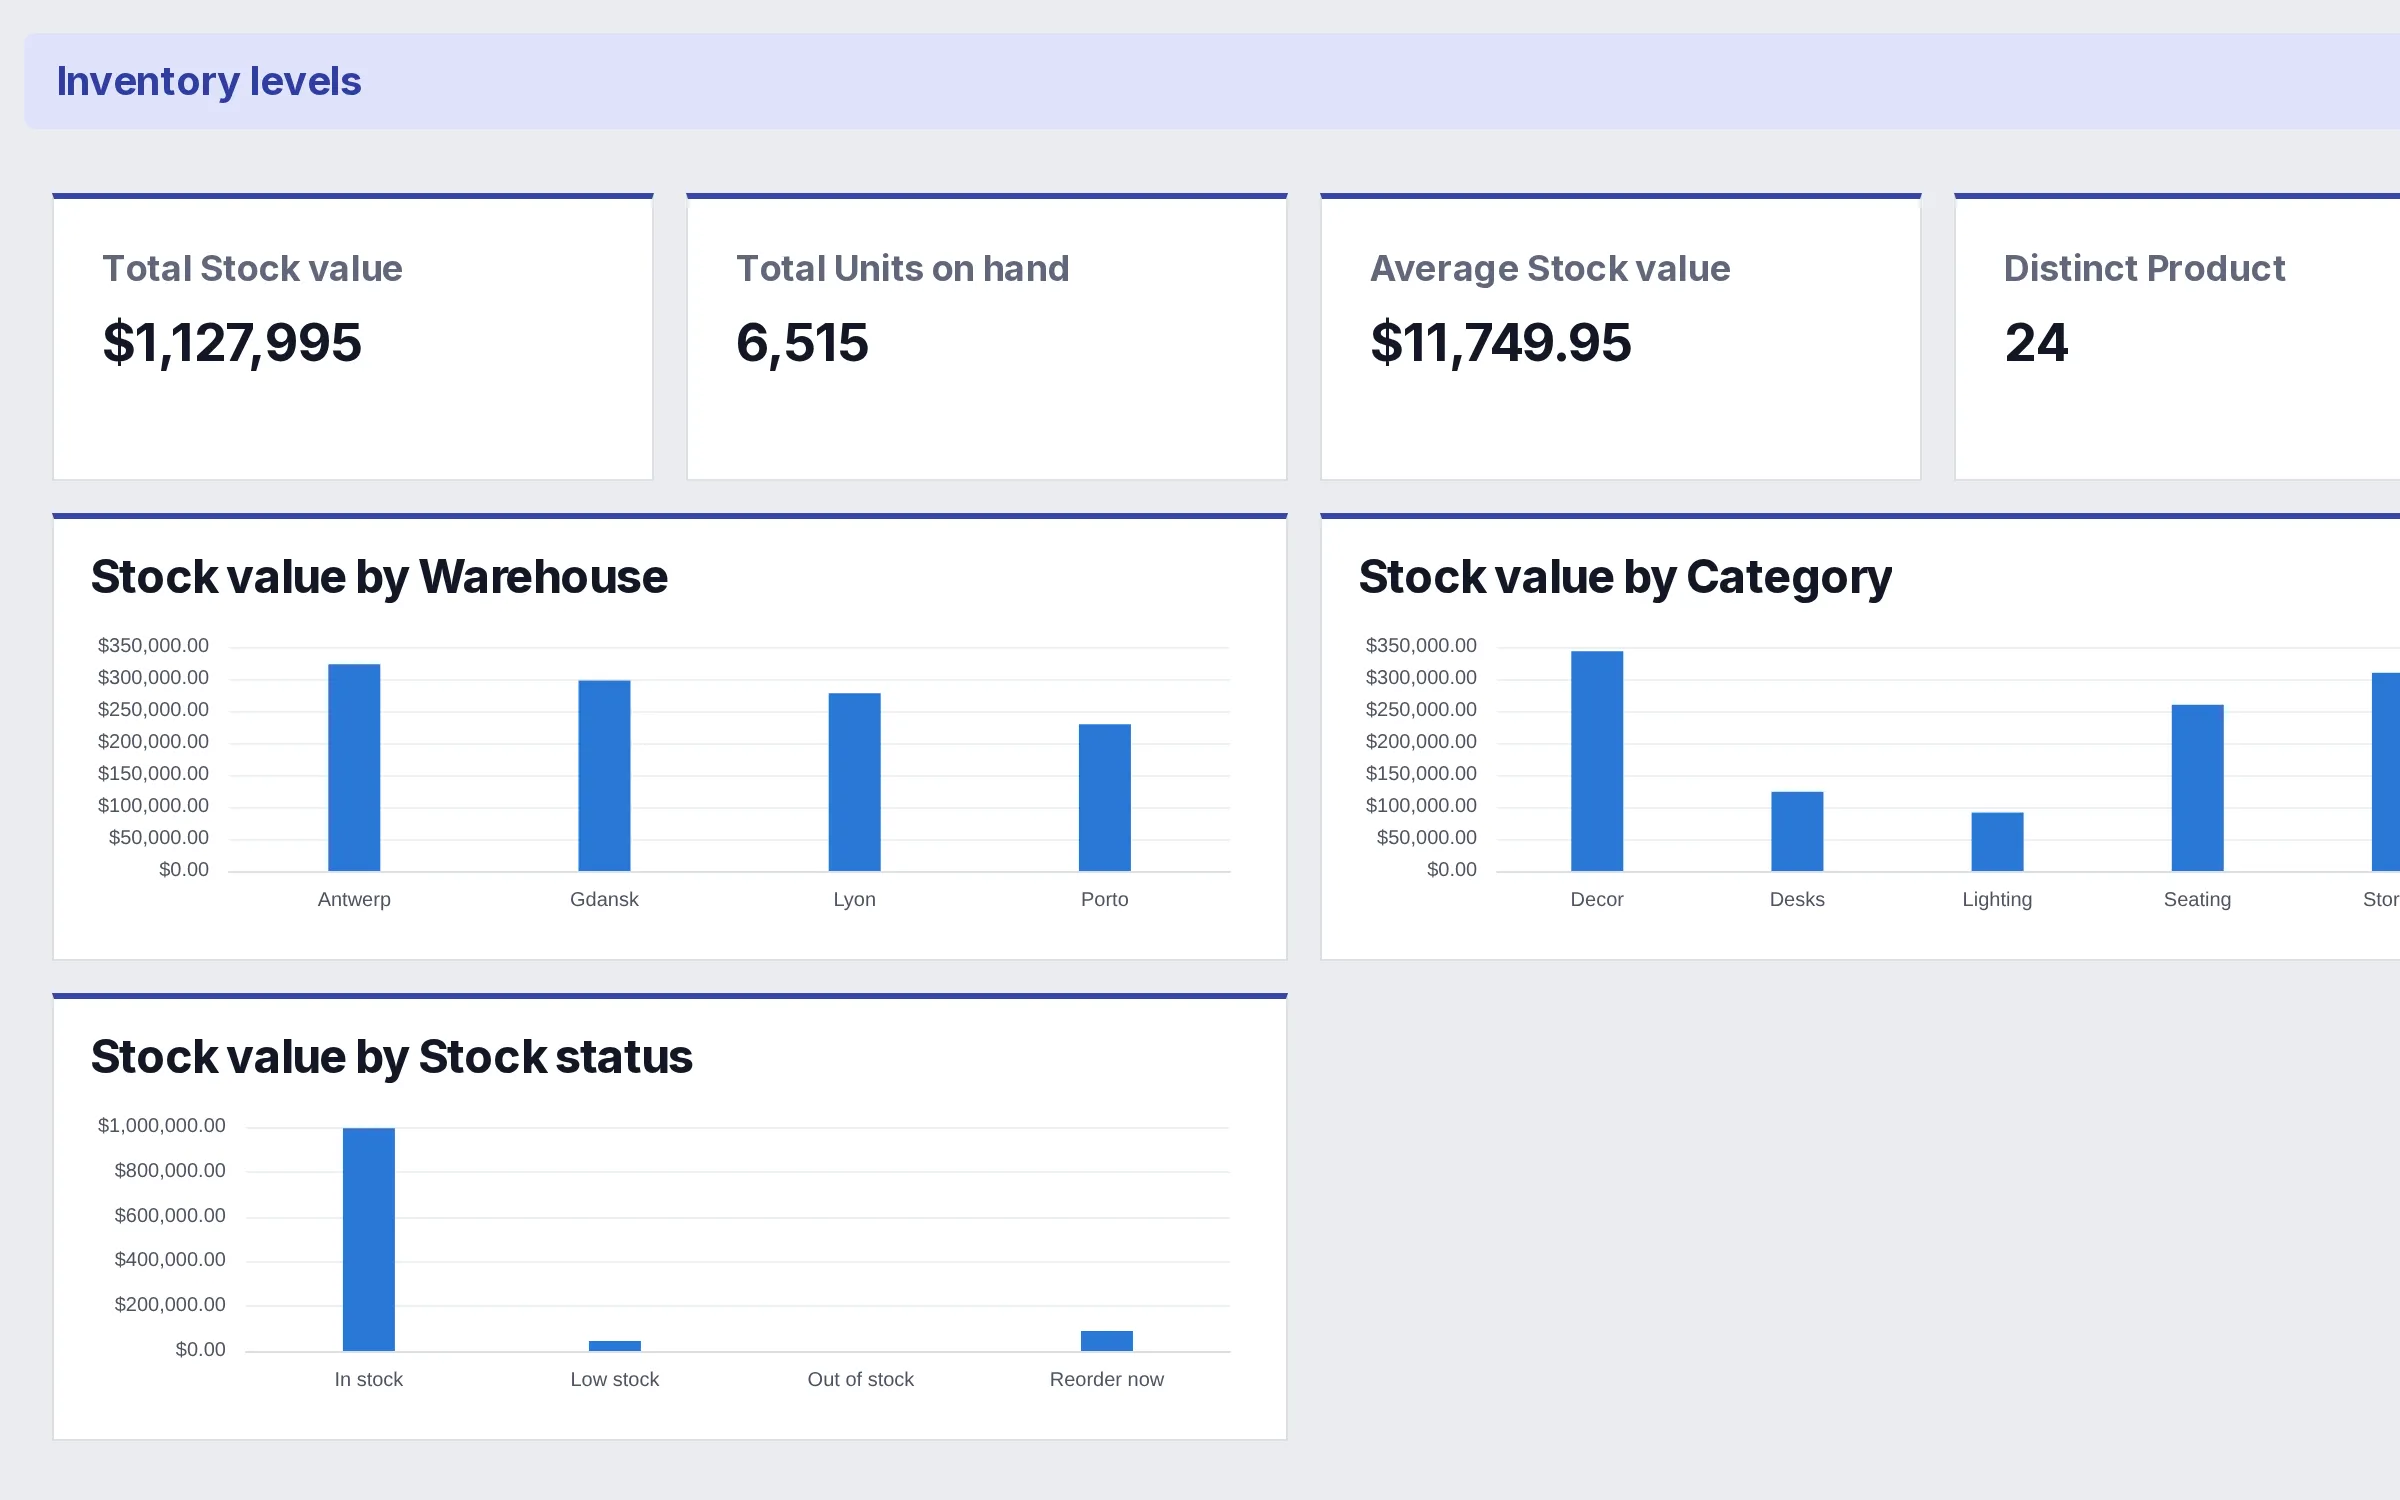
Inventory levels
On-hand stock and stock value by warehouse, category and stock status.
inventory.csv · 6 columns
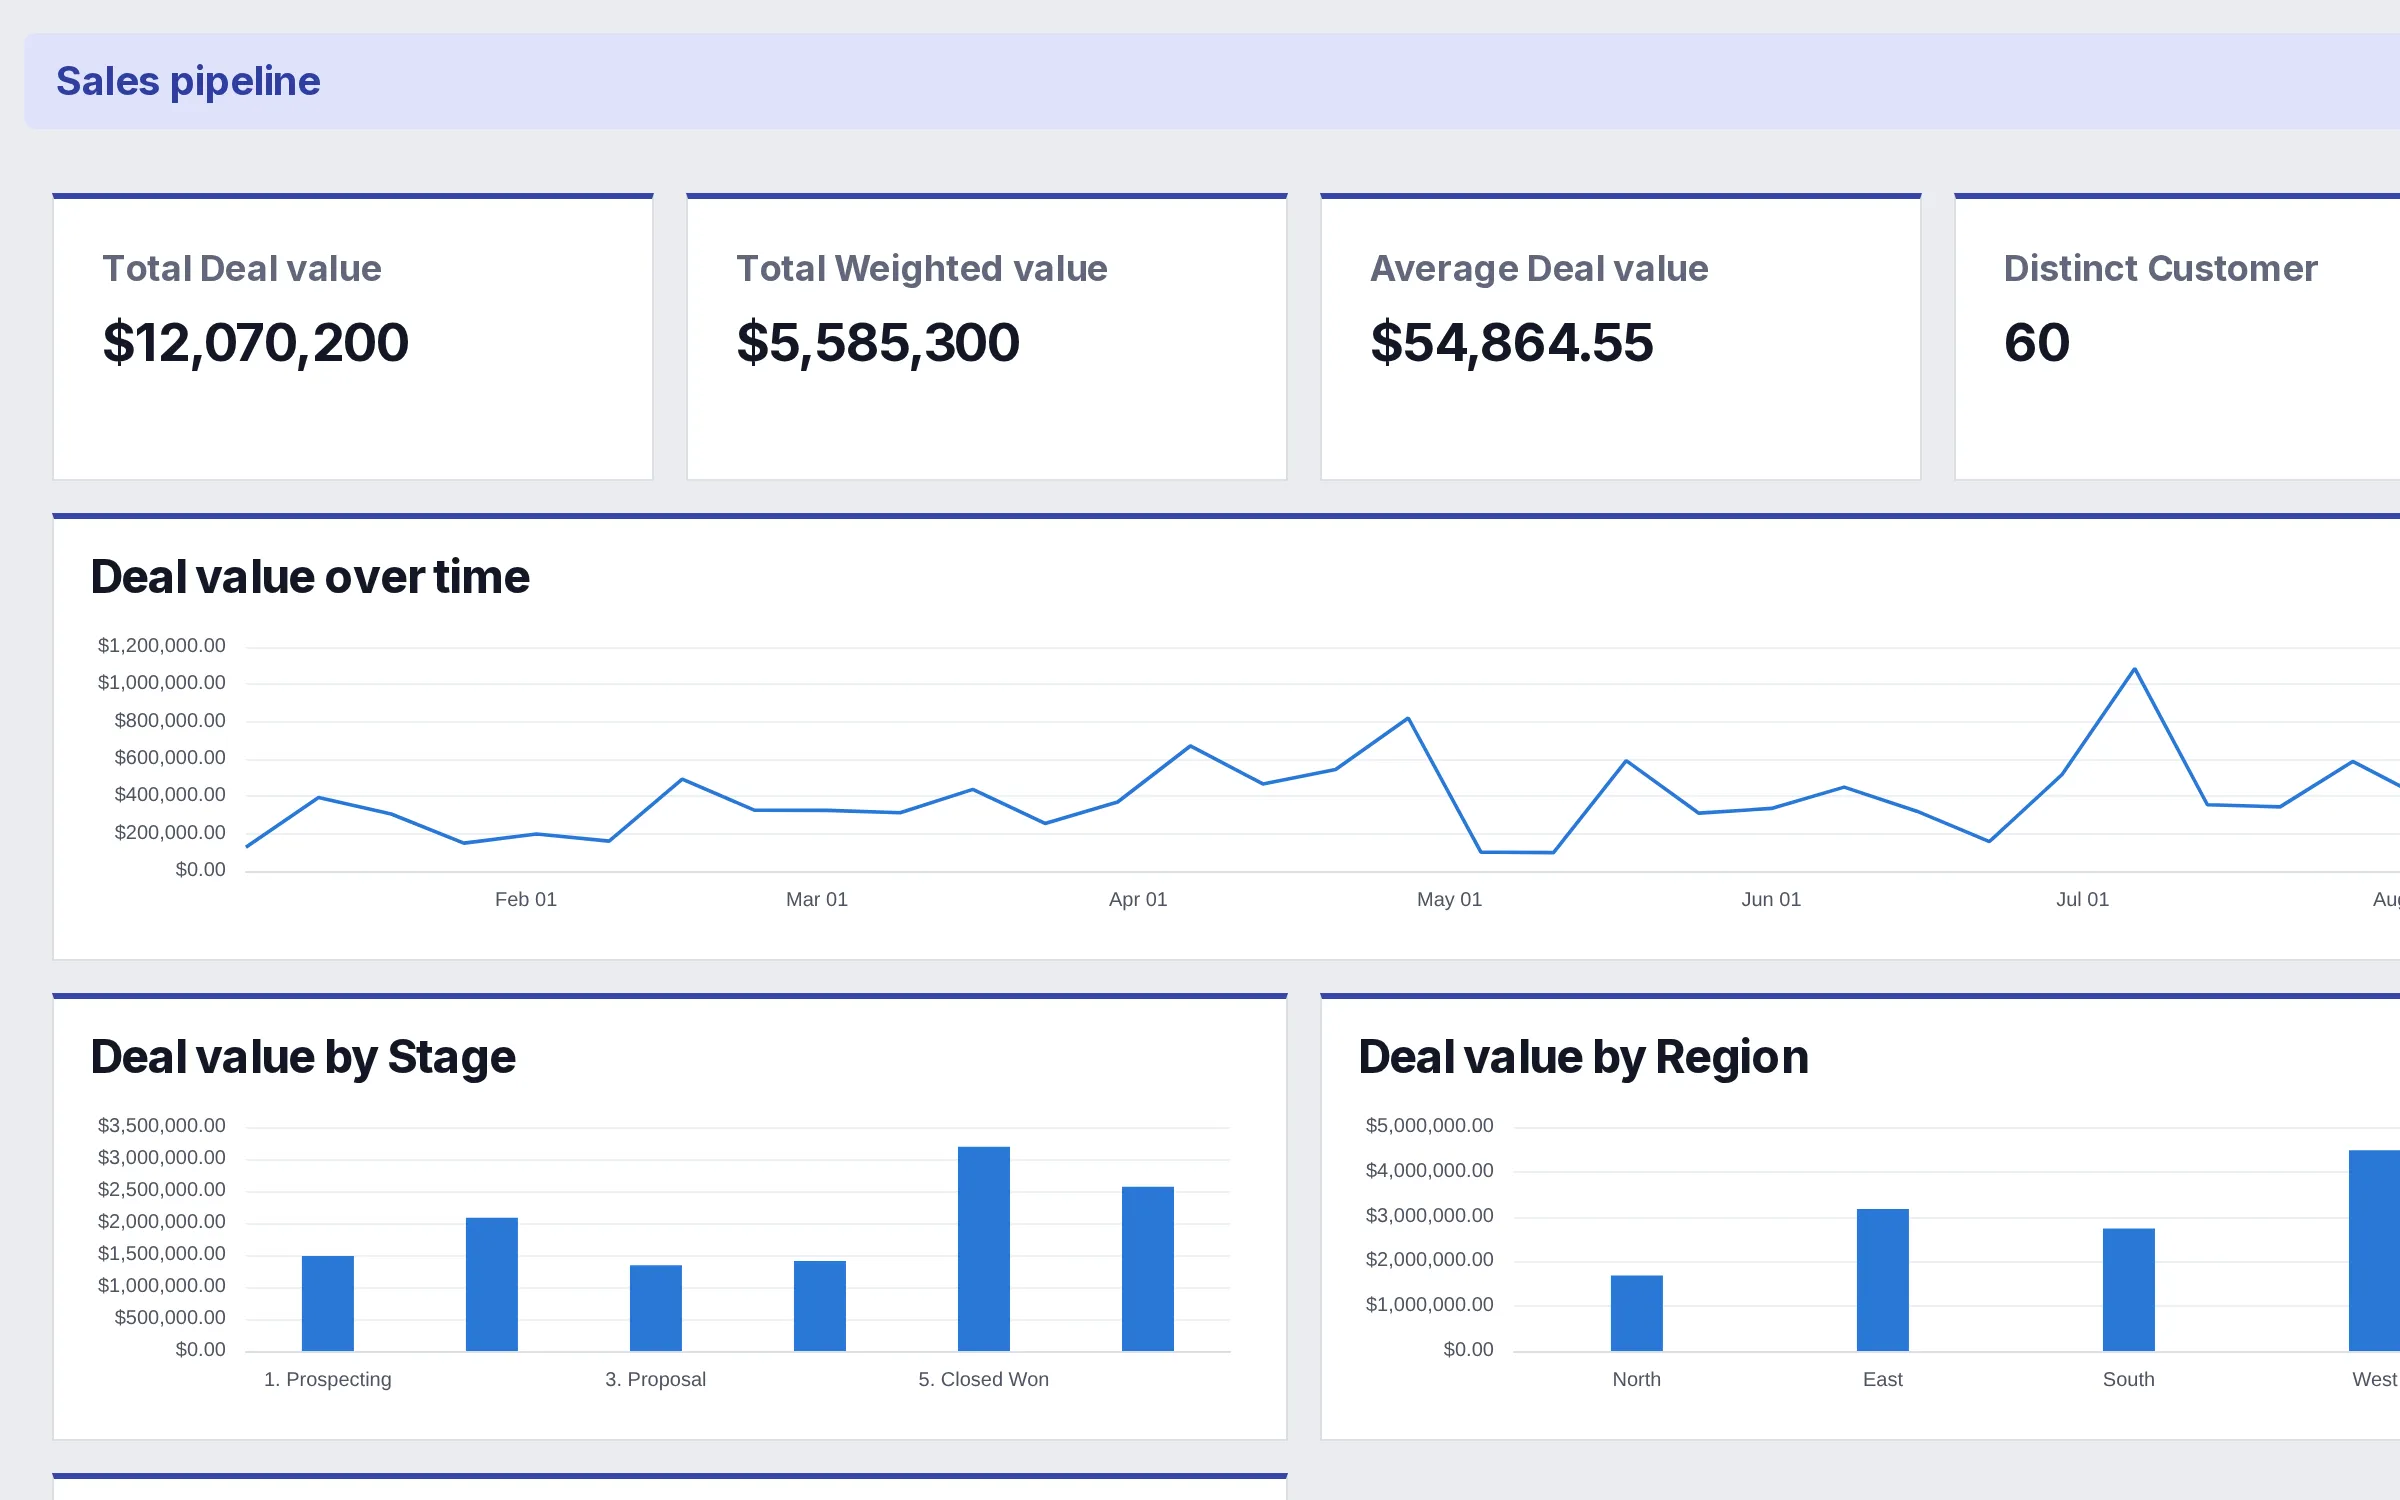
Sales pipeline
Open and closed deal value, weighted pipeline and average deal size by stage, region and product.
sales-pipeline.csv · 11 columns
How it works
Upload the file. Work with the answers.
Upload your file
The CSV or Excel you already have. No setup.
Get a compact dashboard
KPIs, charts, and insights chosen from your data.
Filter, edit & ask
AI proposes and previews — you decide what applies.
Built for the moment
For every “can you pull the numbers?”
Sheet2Chart is built for the questions that can’t wait — and might only matter once.
Why not the usual workarounds
Skip the template, the BI project, and the chat scroll
Instead of a template — Your data bends to fit a template — here, the charts fit your data.
Instead of a BI project — No connectors, no modeling — just the answer you need now.
Instead of a chat scroll — The whole analysis at once: filter it, edit it, keep asking.
Trust
Numbers you can check
Every answer shows the calculation behind it — and when your data can’t answer a question, Sheet2Chart says so.
Built for the work
A dashboard for the next question your team asks
Start with the source export closest to the decision you need to make.
Client reporting from clean source exports
Create a readable dashboard from a client export before the next review call.
Finance views that stay tied to the source file
Turn budget, actuals, or cash-flow spreadsheets into a dashboard that is easy to verify.
Founder-ready answers from a working spreadsheet
Get a clear view of the numbers behind this week's decision — without adopting a BI platform.
Prefer to build it in Excel first? Step-by-step guides: Excel Agencies Finance Marketing Sales Startups Operations Sales KPIs — or compare Sheet2Chart with the tools you already use.
Questions
Before you upload
Do I need an account?
You can open the example dashboards without one. To build a dashboard from your own file, you sign in after uploading — it takes a few seconds, and the dashboard is saved privately to your account.
What files can I upload?
CSV, XLSX, and XLS files up to 25 MB.
How do I know the numbers are right?
Every answer is calculated from your uploaded data, and the calculation is shown with it. If the data can’t answer a question, Sheet2Chart says so instead of inventing a number.
Is my data private?
Yes. Dashboards are private to your account until you delete them, and deleting a project removes its uploaded file and derived data right away.
Can I share or export the result?
Yes — share a link, or export to PDF, PPTX, or an image when the dashboard is ready.
What does it cost?
Nothing right now — Sheet2Chart is free while in beta. No credit card, no trial countdown.
Ready when you are
See what your spreadsheet can answer
Free while in beta — no credit card.